Deployment
Diagram
A full deployment of the application in an AWS environment can include all of the parts shown in the diagram, but various of these parts are optional:
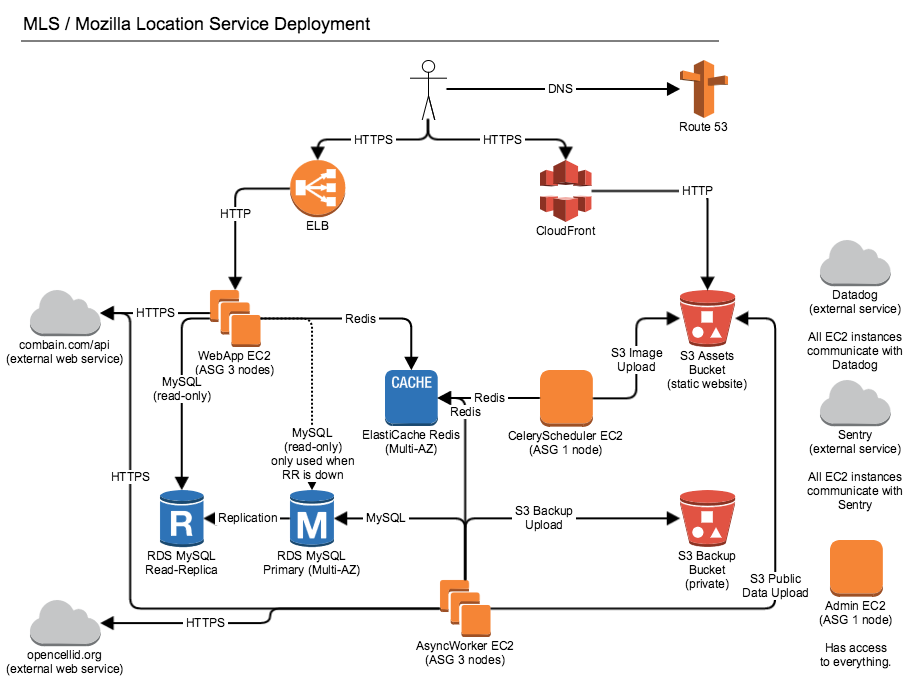
Specifically Amazon CloudFront and S3 are only used for backup and serving image tiles and public data downloads for the public website. Using Combain, Datadog, OpenCellID and Sentry is also optional. Finally there doesn’t have to be a admin EC2 box, but it can be helpful for debug access and running database migrations.
MySQL / Amazon RDS
The application is written and tested against MySQL 5.6.x or Amazon RDS of the same version. The default configuration works for the most part. There are just three changes you need to do. For example via the my.cnf:
[mysqld]
innodb_file_format=Barracuda
innodb_strict_mode=on
sql-mode="NO_ENGINE_SUBSTITUTION,STRICT_TRANS_TABLES"
The web app frontend role only needs access to a read-only read-replica of the database. The async worker backend role needs access to a read-write primary database. You can use load balancers like haproxy to distribute load from the web app frontends over multiple read-replicas. The diagram shows a final fallback connection, where the web app frontends fall back to talking to the primary database if all read-replicas are down. An example of such a haproxy configuration is included in the source code.
Redis / Amazon ElastiCache
The application uses Redis as a queue for the asynchronous task workers and also uses it directly as a cache and to track API key rate limitations.
You can install a standard local Redis for development or production use. The application is also compatible with Amazon ElastiCache (Redis).
Amazon S3
The application uses Amazon S3 for various tasks, including backup of observations, export of the aggregated cell table and hosting of the data map image tiles.
All of these are triggered by asynchronous jobs and you can disable them if you are not hosted in an Amazon environment.
If you use Amazon S3 you might want to configure a lifecycle policy to delete old export files after a couple of days and observation data after one year.
Datadog / Statsd / Sentry
The application uses Statsd to aggregate stats and Sentry to log exception messages.
To use Statsd, you need to configure it in the config file, specifying a host and port, for example localhost port 8125.
To get the app to log exceptions to Sentry, you will need to obtain the DSN for your Sentry instance. Edit location.ini and in the sentry section put your real DSN into the dsn setting.
Installation of Statsd and Sentry are outside the scope of this documentation.
Image Tiles
The code includes functionality to render out image tiles for a data map of places where observations have been made. This part of the code relies on two external projects. One is the datamaps image tile generator the other is pngquant. Make sure to install both of them and make their binaries available on your system path. The datamaps package includes the encode, enumerate and render tools and the pngquant package includes a tool called pngquant. You can install these tools on the server running the celery scheduler (celerybeat) and trigger the location_map script via a cron job.